
250x250
Notice
Recent Posts
Recent Comments
Link
| 일 | 월 | 화 | 수 | 목 | 금 | 토 |
|---|---|---|---|---|---|---|
| 1 | 2 | 3 | 4 | 5 | ||
| 6 | 7 | 8 | 9 | 10 | 11 | 12 |
| 13 | 14 | 15 | 16 | 17 | 18 | 19 |
| 20 | 21 | 22 | 23 | 24 | 25 | 26 |
| 27 | 28 | 29 | 30 |
Tags
- mro()
- MySQL
- discard()
- node.js
- __annotations__
- glob
- 파이썬
- shuffle()
- View
- randrange()
- Database
- MySqlDB
- JS
- fileinput
- remove()
- choice()
- __sub__
- __len__
- 오버라이딩
- CSS
- count()
- items()
- zipfile
- fnmatch
- decode()
- HTML
- locals()
- __getitem__
- inplace()
- shutil
Archives
- Today
- Total
흰둥이는 코드를 짤 때 짖어 (왈!왈!왈!왈!왈!왈!왈!왈!왈!왈!왈!)
(Python) 따릉이 API를 이용한 프로젝트 본문
728x90
반응형
1. API(Application Programming Interface)
- 여러 프로그램들과 데이터베이스, 여러 기능들의 상호 통신 방법을 정하고 도와주는 매개체
2. 따릉이 API 접속하기
import requests                             # fetch랑 비슷
import folium
import json                                 # json 다루는 모듈
from pandas.io.json import json_normalize   # json을 데이터프레임으로 변환
import warnings
warnings.filterwarnings('ignore')           # warning 문구 필터링
targetSite = 'https://www.bikeseoul.com/app/station/getStationRealtimeStatus.do'
request = requests.post(targetSite, data={'stationGrpSeq':'ALL'})
print(request) # <Response [200]>
print(type(request))<Response [200]>
<class 'requests.models.Response'>3. 따릉이 데이터 분석하기
# json.loads(): json타입의 문자열 데이터를 파이썬에서 처리할 수 있도록 변환(딕셔너리)
bike_json = json.loads(request.text)
print(type(bike_json))
<class 'dict'>In [ ]:
# json_normalize(): 딕셔너리 타입의 데이터를 판다스 데이터프레임으로 변환
bike_df = json_normalize(bike_json, 'realtimeList')
bike_df
Out[ ]:
| stationImgFileName | stationId | stationName | stationLongitude | stationLatitude | rackTotCnt | parkingBikeTotCnt | parkingQRBikeCnt | parkingELECBikeCnt | stationSeCd | mode | |
|---|---|---|---|---|---|---|---|---|---|---|---|
| 0 | ST-4 | 102. 망원역 1번출구 앞 | 126.91062927 | 37.55564880 | 15 | 0 | 18 | 6 | RAK_002 | None | |
| 1 | ST-5 | 103. 망원역 2번출구 앞 | 126.91083527 | 37.55495071 | 14 | 0 | 5 | 11 | RAK_002 | None | |
| 2 | ST-6 | 104. 합정역 1번출구 앞 | 126.91498566 | 37.55062866 | 13 | 0 | 14 | 0 | RAK_002 | None | |
| 3 | ST-7 | 105. 합정역 5번출구 앞 | 126.91482544 | 37.55000687 | 5 | 0 | 1 | 0 | RAK_002 | None | |
| 4 | ST-8 | 106. 합정역 7번출구 앞 | 126.91282654 | 37.54864502 | 12 | 0 | 10 | 0 | RAK_002 | None | |
| ... | ... | ... | ... | ... | ... | ... | ... | ... | ... | ... | ... |
| 2709 | ST-3204 | 5865.더리브오피스텔 앞 | 126.91259766 | 37.51791763 | 10 | 0 | 0 | 0 | RAK_002 | None | |
| 2710 | ST-3212 | 5866.포레나 당산 | 126.89550781 | 37.52195358 | 8 | 0 | 3 | 0 | RAK_002 | None | |
| 2711 | ST-3235 | 5867. H타워 앞 | 126.91245270 | 37.52024078 | 10 | 0 | 0 | 1 | RAK_002 | None | |
| 2712 | ST-3161 | 6053. 중부세무서 앞 | 126.99066162 | 37.56092453 | 5 | 0 | 2 | 0 | RAK_002 | None | |
| 2713 | ST-3210 | 6054.청구e편한세상아파트 113동 앞 | 127.01821136 | 37.56104279 | 5 | 0 | 1 | 0 | RAK_002 | None |
2714 rows × 11 columns
In [ ]:
bike_df.columns
Out[ ]:
Index(['stationImgFileName', 'stationId', 'stationName', 'stationLongitude',
       'stationLatitude', 'rackTotCnt', 'parkingBikeTotCnt',
       'parkingQRBikeCnt', 'parkingELECBikeCnt', 'stationSeCd', 'mode'],
dtype='object')- stationImgFileName: 대여소 사진
- stationId: 고유한 대여소 번호
- stationName: 대여소 이름
- stationLongitude: 대여소 경도
- stationLatitude: 대여소 위도
- rackTotCnt: 주차 가능한 전체 자전거 대수
- parkingBikeTotCnt: 주차된 따릉이 총 대수
- parkingQRBikeCnt: 주차된 따릉이 QR형 총 대수
- parkingELECBikeCnt: 주차된 새싹 따릉이 총 대수
In [ ]:
bike_df_map = bike_df[['stationName', 'stationLongitude', 'stationLatitude', 'rackTotCnt',
                       'parkingBikeTotCnt', 'parkingQRBikeCnt', 'parkingELECBikeCnt']]
bike_df_map
Out[ ]:
| stationName | stationLongitude | stationLatitude | rackTotCnt | parkingBikeTotCnt | parkingQRBikeCnt | parkingELECBikeCnt | |
|---|---|---|---|---|---|---|---|
| 0 | 102. 망원역 1번출구 앞 | 126.91062927 | 37.55564880 | 15 | 0 | 18 | 6 |
| 1 | 103. 망원역 2번출구 앞 | 126.91083527 | 37.55495071 | 14 | 0 | 5 | 11 |
| 2 | 104. 합정역 1번출구 앞 | 126.91498566 | 37.55062866 | 13 | 0 | 14 | 0 |
| 3 | 105. 합정역 5번출구 앞 | 126.91482544 | 37.55000687 | 5 | 0 | 1 | 0 |
| 4 | 106. 합정역 7번출구 앞 | 126.91282654 | 37.54864502 | 12 | 0 | 10 | 0 |
| ... | ... | ... | ... | ... | ... | ... | ... |
| 2709 | 5865.더리브오피스텔 앞 | 126.91259766 | 37.51791763 | 10 | 0 | 0 | 0 |
| 2710 | 5866.포레나 당산 | 126.89550781 | 37.52195358 | 8 | 0 | 3 | 0 |
| 2711 | 5867. H타워 앞 | 126.91245270 | 37.52024078 | 10 | 0 | 0 | 1 |
| 2712 | 6053. 중부세무서 앞 | 126.99066162 | 37.56092453 | 5 | 0 | 2 | 0 |
| 2713 | 6054.청구e편한세상아파트 113동 앞 | 127.01821136 | 37.56104279 | 5 | 0 | 1 | 0 |
2714 rows × 7 columns
In [ ]:
bike_df_map.dtypes
Out[ ]:
stationName           object
stationLongitude      object
stationLatitude       object
rackTotCnt            object
parkingBikeTotCnt     object
parkingQRBikeCnt      object
parkingELECBikeCnt    object
dtype: object
In [ ]:
# 위도, 경도 -> float로 변환
# bike_df_map = bike_df_map.astype({'stationLongitude':'float', 'stationLatitude':'float'})
bike_df_map['stationLongitude'] = bike_df_map['stationLongitude'].astype(float)
bike_df_map['stationLatitude'] = bike_df_map['stationLatitude'].astype(float)

# 전체 자전거 대수, 주차된 자전거 총 대수, 주차된 QR 자전거 총 대수, 주차된 새싹 자전거 총 대수 -> int
# bike_df_map = bike_df_map.astype({'rackTotCnt':'int', 'parkingBikeTotCnt':'int', 'parkingQRBikeCnt':'int', 'parkingELECBikeCnt':'int'})
bike_df_map['rackTotCnt'] = bike_df_map['rackTotCnt'].astype(int)
bike_df_map['parkingBikeTotCnt'] = bike_df_map['parkingBikeTotCnt'].astype(int)
bike_df_map['parkingQRBikeCnt'] = bike_df_map['parkingQRBikeCnt'].astype(int)
bike_df_map['parkingELECBikeCnt'] = bike_df_map['parkingELECBikeCnt'].astype(int)

# total 파생변수 추가 -> 주차된 자전거 총 대수 + 주차된 QR 자전거 총 대수 + 주차된 새싹 자전거 총 대수
bike_df_map['total'] = bike_df_map['parkingBikeTotCnt'] + bike_df_map['parkingQRBikeCnt'] + bike_df_map['parkingELECBikeCnt']
In [ ]:
bike_df_map.dtypes
Out[ ]:
stationName            object
stationLongitude      float64
stationLatitude       float64
rackTotCnt              int64
parkingBikeTotCnt       int64
parkingQRBikeCnt        int64
parkingELECBikeCnt      int64
total                   int64
dtype: object
In [ ]:
bike_df_map.head()
Out[ ]:
| stationName | stationLongitude | stationLatitude | rackTotCnt | parkingBikeTotCnt | parkingQRBikeCnt | parkingELECBikeCnt | total | |
|---|---|---|---|---|---|---|---|---|
| 0 | 102. 망원역 1번출구 앞 | 126.910629 | 37.555649 | 15 | 0 | 18 | 6 | 24 |
| 1 | 103. 망원역 2번출구 앞 | 126.910835 | 37.554951 | 14 | 0 | 5 | 11 | 16 |
| 2 | 104. 합정역 1번출구 앞 | 126.914986 | 37.550629 | 13 | 0 | 14 | 0 | 14 |
| 3 | 105. 합정역 5번출구 앞 | 126.914825 | 37.550007 | 5 | 0 | 1 | 0 | 1 |
| 4 | 106. 합정역 7번출구 앞 | 126.912827 | 37.548645 | 12 | 0 | 10 | 0 | 10 |
In [ ]:
bike_df_map.shape
Out[ ]:
(2714, 8)In [ ]:
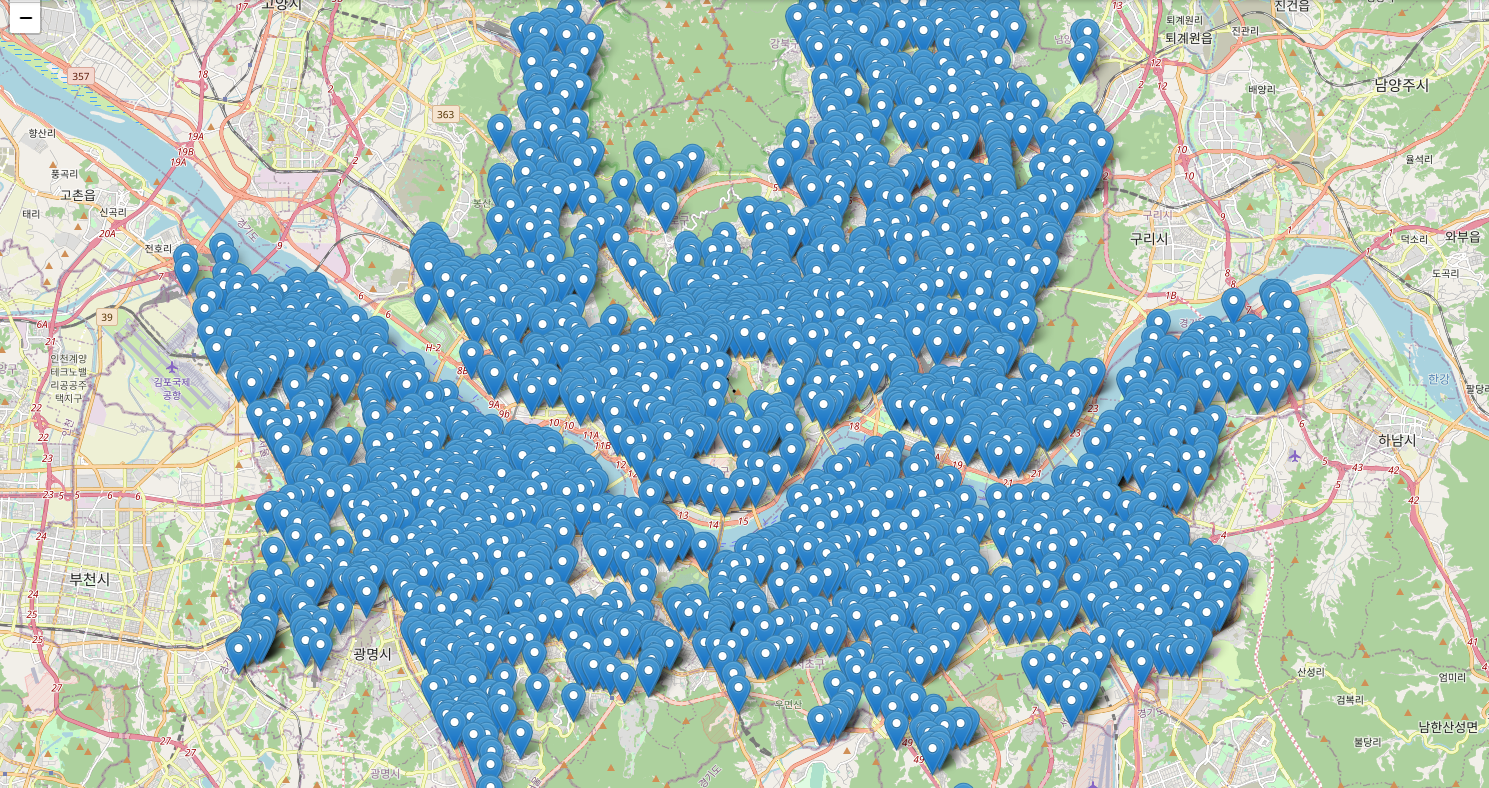
# 따릉이 모든 데이터를 지도에 표시하기
# 팝업 -> 대여소이름, 이름:X대, QR:X대, 새싹:X대, 총:X대

map = folium.Map(location=[bike_df_map['stationLatitude'].mean(), bike_df_map['stationLongitude'].mean()], zoom_start=12)
for index, row in bike_df_map.iterrows():
    popup = folium.Popup(f"{row['stationName']}, 일반: {row['parkingBikeTotCnt']}대, QR:{row['parkingQRBikeCnt']}대, 새싹:{row['parkingELECBikeCnt']}대, 총:{row['total']}대", max_width=200)
    folium.Marker(location=[row['stationLatitude'], row['stationLongitude']], popup=popup).add_to(map)
map
Out[ ]:
In [ ]:
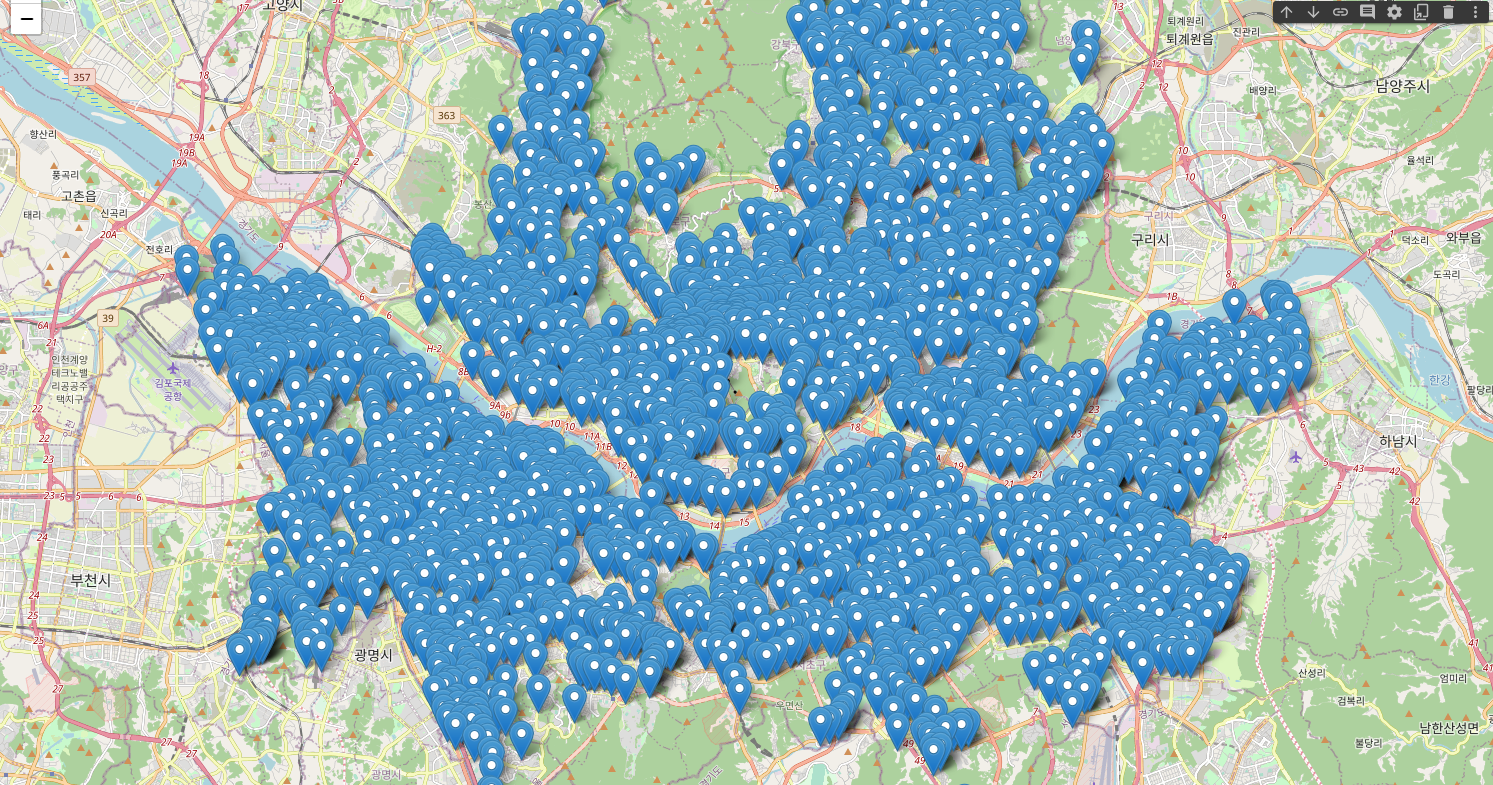
# 따릉이 모든 데이터를 지도에 표시하기
# 팝업 -> 대여소이름 일반:X대, QR:X대, 새싹:X대, 총:X대
bike_map = folium.Map(location=[bike_df_map['stationLatitude'].mean(), bike_df_map['stationLongitude'].mean()], zoom_start=12)
for index, data in bike_df_map.iterrows():
    string = '{} 일반:{}대, QR:{}대, 새싹:{}대, 총:{}대'.format(data['stationName'], data['parkingBikeTotCnt'],
                                                       data['parkingQRBikeCnt'], data['parkingELECBikeCnt'], data['total'])
    popup = folium.Popup(string, max_width=600)
    folium.Marker(location=[data['stationLatitude'], data['stationLongitude']], popup=popup).add_to(bike_map)
bike_map
Out[ ]:
728x90
반응형
'파이썬 데이터 분석' 카테고리의 다른 글
| (Python) 떡볶이집의 입점전략 (1) | 2023.06.09 |
|---|---|
| (Python) 스타벅스 API를 이용한 프로젝트 (0) | 2023.06.09 |
| (Python) 전국 도시공원 데이터 프로젝트 (0) | 2023.06.09 |
| (Python) 상권별 업종 밀집 통계 프로젝트 (0) | 2023.06.09 |
| (Python) folium (0) | 2023.06.08 |
'파이썬 데이터 분석' Related Articles
more


Comments